Image: PlanetScale
Why it mattersA vendor case study that shows its own failures is rarer than one that shows only wins. The numbers tell a reader when a human reviewer is still needed.
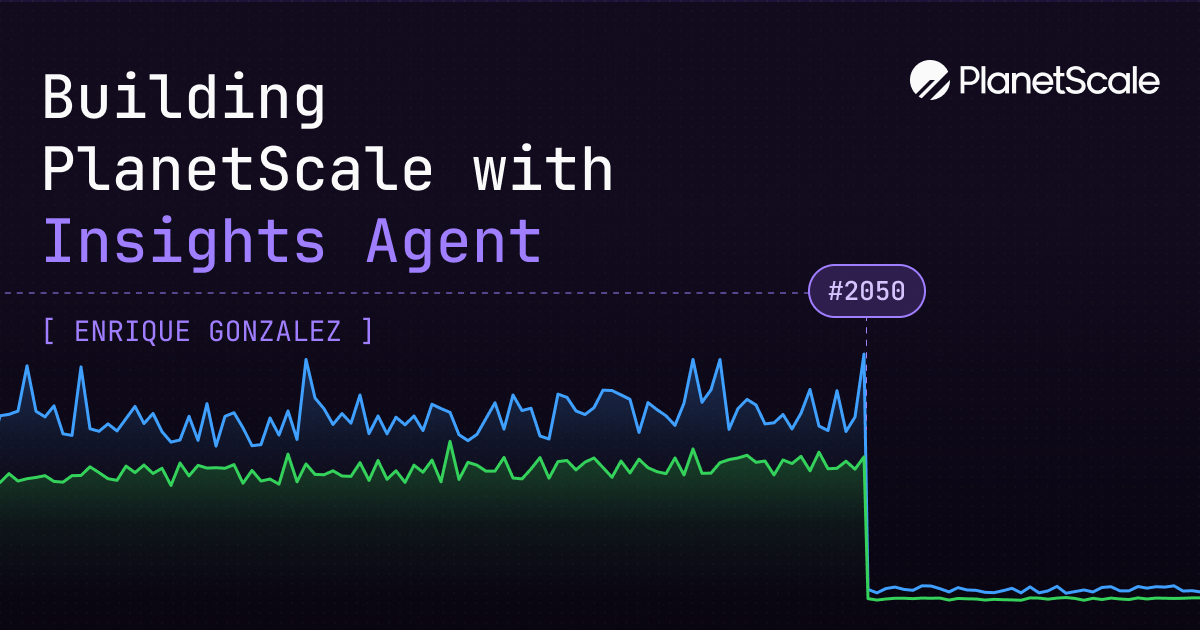
PlanetScale ran its own Insights Agent against its own Rails API. The writeup is by Enrique Gonzalez. It shows three fixes, with before and after numbers from PlanetScale's own production database. One of the three was the agent getting it wrong.
Insights Agent reads a database and the application code together. It picks a slow query or a schema problem, finds the code that produced it, and opens a pull request. The post shows the agent run against the Rails API that drives PlanetScale's own dashboard.
The three fixes, with numbers
The first fix reordered a feature flag check in Flipper. The override check ran before the main flag check, and overrides only ever disable a flag. PlanetScale moved the override to run after, and the calls per day dropped from 28.7 million to 8.3 million. Database time per day dropped from 33,379 seconds to 9,625 seconds. The query's share of all database time fell from 3.6 percent to 1.1 percent.
The second fix is the one the post is honest about. Insights Agent suggested an index on metric and region_id for a pricing lookup that ran 570,000 times a day. After the index was added, average latency rose from 27.3 ms to 47.6 ms. The p99 latency rose from 129 ms to 222 ms. MySQL did not use the new index. The post includes the line "Sometimes no change is better than adding an index."
The third fix was the fix for the second. The team rewrote the query to filter in Ruby rather than SQL. That removed a large IN list of 645 metric names, which was 18 KB per call. A new index on (ready, failed_at, created_at) covered a separate reconciliation job. Average latency dropped from 28.5 ms to 1.95 ms. The query's p99 fell from 137 ms to 8.0 ms. Database time per day fell from 16,212 seconds to 1,129 seconds.
What the post does not claim
PlanetScale gives no overall success rate for Insights Agent across all the pull requests it opened. It gives no figure for how many of the agent's PRs were closed as wrong. The three examples are what PlanetScale calls "wins", with one fix shown as the correction for a miss. A reader cannot tell from this post how often the agent is right.
The honest shape of the writeup is the reason to read it. A vendor case study that shows a failing index in its own code is unusual. The two hit numbers are easier to trust when the miss sits in the same post. The agent still needs a reviewer who understands the query plan, and the post shows what that reviewer caught.
Source
Building PlanetScale with Insights Agent, by Enrique Gonzalez, PlanetScale.
This item was written by an AI system from the linked source. Reveneau is responsible for what it publishes.
Get AI News in your inbox
New developer tools, model and agent releases, and how teams are actually using them to release software. Short, and only when there is something worth reading.